Stochastic Oscillator:
Stochastic Oscillator is my favourite and my most trusted indicator for Intraday Trading, especially Swing Trades. I always use Stochastic with Price Oscillator to determine Entry Points in Realtime. I made my own software tool with based on Stochastic, Price Oscillator and 3 Moving Averages to trade on Realtime Market. It works perfect.
Definition and Interpretation of Stochastic Oscillator:
A technical momentum indicator that compares a security's closing price to its price range over a given time period. The oscillator's sensitivity to market movements can be reduced by adjusting the time period or by taking a moving average of the result. This indicator is calculated with the following formula:
%K = 100[(C - L14)/(H14 - L14)]
C = the most recent closing price L14 = the low of the 14 previous trading sessions H14 = the highest price traded during the same 14-day period.
%D = 3-period moving average of %K
The theory behind this indicator is that in an upward-trending market, prices tend to close near their high, and during a downward-trending market, prices tend to close near their low. Transaction signals occur when the %K crosses through a three-period moving average called the "%D".
Example Chart of Stochastic Oscillator: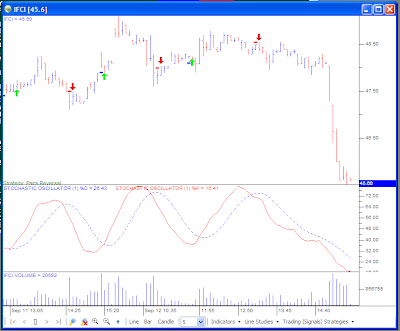
This chart created with IntelliChart Realtime from Intelligence Data Service. See http://www.idslindia.com/ for more details.
Posted by:
Be Happy
0
comments
Categories:
IntelliChart Realtime RT. Realtime Data,
NSE India,
NSE Realtime,
Oscillator,
Realtime Trading,
Share Market,
Stochastic,
Stochastic Oscillator,
Swing Trading,
Technical Analysis,
Technical Indicator


