Showing posts with label NSE Realtime. Show all posts

Stochastic Oscillator:
Stochastic Oscillator is my favourite and my most trusted indicator for Intraday Trading, especially Swing Trades. I always use Stochastic with Price Oscillator to determine Entry Points in Realtime. I made my own software tool with based on Stochastic, Price Oscillator and 3 Moving Averages to trade on Realtime Market. It works perfect.

Definition and Interpretation of Stochastic Oscillator:
A technical momentum indicator that compares a security's closing price to its price range over a given time period. The oscillator's sensitivity to market movements can be reduced by adjusting the time period or by taking a moving average of the result. This indicator is calculated with the following formula:
%K = 100[(C - L14)/(H14 - L14)]
C = the most recent closing price L14 = the low of the 14 previous trading sessions H14 = the highest price traded during the same 14-day period.
%D = 3-period moving average of %K

The theory behind this indicator is that in an upward-trending market, prices tend to close near their high, and during a downward-trending market, prices tend to close near their low. Transaction signals occur when the %K crosses through a three-period moving average called the "%D".

Example Chart of Stochastic Oscillator:
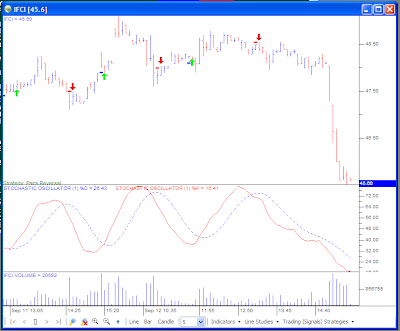

This chart created with IntelliChart Realtime from Intelligence Data Service. See http://www.idslindia.com/ for more details.

Tuesday, August 19, 2008

Accumulation / Distribution

Accumulation/Distribution

Accumulation/Distribution Technical Indicator is determined by the changes in price and volume. The volume acts as a weighting coefficient at the change of price รข€” the higher the coefficient (the volume) is, the greater the contribution of the price change (for this period of time) will be in the value of the indicator.

In fact, this indicator is a variant of the more commonly used indicator On Balance Volume. They are both used to confirm price changes by means of measuring the respective volume of sales.

When the Accumulation/Distribution indicator grows, it means accumulation (buying) of a particular security, as the overwhelming share of the sales volume is related to an upward trend of prices. When the indicator drops, it means distribution (selling) of the security, as most of sales take place during the downward price movement.

Divergences between the Accumulation/Distribution indicator and the price of the security indicate the upcoming change of prices. As a rule, in case of such divergences, the price tendency moves in the direction in which the indicator moves. Thus, if the indicator is growing, and the price of the security is dropping, a turnaround of price should be expected.

Calculation:
A certain share of the daily volume is added to or subtracted from the current accumulated value of the indicator. The nearer the closing price to the maximum price of the day is, the higher the added share will be. The nearer the closing price to the minimum price of the day is, the greater the subtracted share will be. If the closing price is exactly in between the maximum and minimum of the day, the indicator value remains unchanged.

A/D(i) =((CLOSE(i) - LOW(i)) - (HIGH(i) - CLOSE(i)) * VOLUME(i) / (HIGH(i) - LOW(i)) + A/D(i-1)

Where:
A/D(i) importance of the Indicator of the Accumulation/Distribution for the current bar;
CLOSE(i) the price of the closing the bar;
LOW(i) the minimum price of the bar;
HIGH(i) the maximum price of the bar;
VOLUME(i) volume;
A/D(i-1) importance of the Indicator of the Accumulation/Distribution for previous bar.

Trading UseAccumulation Distribution is usually used as a divergence indicator, with long entries signaled by bullish divergence, and short entries signaled by bearish divergence. Accumulation Distribution can also be used as an exit indicator, by showing the end (or the weakening) of the current trend.