Thursday, February 4, 2010

Basic Elliott Wave Theory

Basic Elliott Wave Theory:

Elliott Wave was developed by R. N. Elliott (1938) as a way of analysing the equity markets, which tend to have a natural bullish cycle. This should be borne in mind when attempting to apply this principle to markets, which do not have the same cyclical tendencies, such as currencies and bonds. From the analytical perspective , the key is to determine the impulsive and corrective waves. Once the impulsive waves have been identified, the five wave sequence needs to be identified to provide a starting point from which to commence the analysis.


A typical wave pattern consists of five waves up in a bull markets, followed by three waves down.

The “five waves up” consists of three impulsive waves, 1, 3 and 5 and two corrective waves, 2 and 4. The correction following the completion of the five waves unfolds in three corrective waves, a, b and c. (See diagram below)

Each of the impulsive waves should break down into five waves of lower degree. One of the tenets of the Elliott Wave Principle is that two of the impulsive waves will tend to be of equal length, if not the relationship will tend to be 1:1.618 (key Fibonacci ratio). The corrective waves will often follow the “Rule of Alternation” in that if wave 2 is a simple one, wave 4 will tend to be complex, and vice versa.

The Elliott Wave relationship with Fibonacci ratios is quite strong, with corrective waves often retracing 38.2% or 61.8% of the impulsive waves. In addition, waves 2 and 4 are often related by these ratios.
Guidelines:
1) Wave 3 cannot be the shortest of the impulsive waves
2) 1 and 4 should not overlap (unless in a diagonal triangle)
3) Wave 2 and 4 should alternate (if one is complex, the other should be simple)

Corrective Waves (waves two and 4 and A-B-C) can take many forms but the most usual are:
1) 5-3-5 (Zig-Zag)
2) 3-3-5 (Flat)
3) 3-3-3-3-3 (Flat)
4) Double and triple threes (combined structures)

Tuesday, January 5, 2010

Bollinger Bands

Introduction :
Developed by John Bollinger, Bollinger Bands are an indicator that allows users to compare volatility and relative price levels over a period time. The indicator consists of three bands designed to encompass the majority of a security's price action.

1. A simple moving average in the middle
2. An upper band (SMA plus 2 standard deviations)
3. A lower band (SMA minus 2 standard deviations)


Standard deviation is a statistical unit of measure that provides a good assessment of a price plot's volatility. Using the standard deviation ensures that the bands will react quickly to price movements and reflect periods of high and low volatility. Sharp price increases (or decreases), and hence volatility, will lead to a widening of the bands.


The center band is the 20-day simple moving average. The upper band is the 20-day simple moving average plus 2 standard deviations. The lower band is the 20-day simple moving average less 2 standard deviations.

Thursday, August 6, 2009

Average True Range (ATR)

Average True Range (ATR)

Introduction :

Developed by J. Welles Wilder and introduced in his book, New Concepts in Technical Trading Systems (1978), the Average True Range (ATR) indicator measures a security's volatility. As such, the indicator does not provide an indication of price direction or duration, simply the degree of price movement or volatility.

As with most of his indicators, Wilder designed ATR with commodities and daily prices in mind. In 1978, commodities were frequently more volatile than stocks. They were (and still are) often subject to gaps and limit moves. (A limit move occurs when a commodity opens up or down its maximum allowed move and does not trade again until the next session. The resulting bar or candlestick would simply be a small dash.) In order to accurately reflect the volatility associated with commodities, Wilder sought to account for gaps, limit moves, and small high-low ranges in his calculations. A volatility formula based on only the high-low range would fail to capture the actual volatility created by the gap or limit move.

Wilder started with a concept called True Range (TR) which is defined as the greatest of the following:

The current High less the current Low.
The absolute value of the current High less the previous Close.
The absolute value of the current Low less the previous Close.
If the current high-low range is large, chances are it will be used as the True Range. If the current high-low range is small, it is likely that one of the other two methods would be used to calculate the True Range. The last two possibilities usually arise when the previous close is greater than the current high (signaling a potential gap down or limit move) or the previous close is lower than the current low (signaling a potential gap up or limit move).
To ensure positive numbers, absolute values were applied to differences.


The example above shows three potential situations when the TR would not be based on the current high/low range. Notice that all three examples have small high/low ranges and two examples show a significant gap.

A small high/low range formed after a gap up. The TR was found by calculating the absolute value of the difference between the current high and the previous close.


A small high/low range formed after a gap down. The TR was found by calculating the absolute value of the difference between the current low and the previous close.

Even though the current close is within the previous high/low range, the current high/low range is quite small. In fact, it is smaller than the absolute value of the difference between the current high and the previous close, which is used to value the TR.

Note:
Because the ATR shows volatility as an absolute level, low price stocks will have lower ATR levels than high price stocks. For example, a $10 security would have a much lower ATR reading than a $200 stock. Because of this, ATR readings can be difficult to compare across a range of securities. Even for a single security, large price movements, such as a decline from 70 to 20, can make long-term ATR comparisons difficult.

Calculation :
Typically, the Average True Range (ATR) is based on 14 periods and can be calculated on an intraday, daily, weekly or monthly basis. For this example, the ATR will be based on daily data. Because there must be a beginning, the first TR value in a series is simply the High minus the Low, and the first 14-day ATR is the average of the daily ATR values for the last 14 days. After that, Wilder sought to smooth the data set, by incorporating the previous period's ATR value. The second and subsequent 14-day ATR value would be calculated with the following steps:


1. Multiply the previous 14-day ATR by 13.
2. Add the most recent day's TR value.
3. Divide by 14.


In the Excel spread sheet example above, the first True Range value (1.9688) equals the High minus the Low. The first 14-day ATR value (3.6646) was calculated by finding the average of first 14 True Range values. The second ATR value was smoothed by using the previous value.


For those trying this at home, here are a few caveats: There is always a beginning, and the first calculations may not conform exactly with the formula.

The first True Range value is simply the High minus the Low, and the first ATR is a simple average of the first 14 True Range values.

Many indicators involve a smoothing process. In this example, the current ATR calculation uses the previous period's ATR.

The size of the data set will affect the final outcome. This example only contains a small portion of the available historical price data.

Although the difference is not likely to be huge, a data set of 33 days will produce a different ATR value than a data set of 500 days.

Due to rounding issues and decimal places, an exact match may not be possible.


(If you want to create an ATR from your own data, first try to duplicate the above example using the provided Open-High-Low-Close data. Once your calculations match the example's, you can then plug in your own Open-High-Low-Close data.)


The IBM chart above provides an example of the 14-day ATR in action. Extreme levels (both high and low) can mark turning points or the beginning of a move. As a volatility-based indicator like Bollinger Bands, the ATR cannot predict direction or duration, simply activity levels. Low levels indicate quiet trading (small ranges), and high levels indicate violent trading (large ranges). A prolonged period of low ATR readings might indicate consolidation and the beginning of a continuation move or reversal. High ATR readings usually result from a sharp advance or decline and are unlikely to be sustained for extended periods.

Average True Range (ATR) and SharpCharts :

The ATR is on the Indicators drop-down menu, listed as "Average True Range." The Parameters box to the right of the indicator contains the default value, 14, for the number of periods used to smooth the data. To adjust the period setting, highlight the default value, and enter a new period setting. SharpCharts also allows you to position the indicator above, below, or behind the price plot.

Stochastic Oscillator:
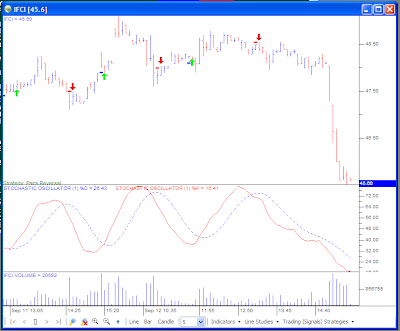
Stochastic Oscillator is my favourite and my most trusted indicator for Intraday Trading, especially Swing Trades. I always use Stochastic with Price Oscillator to determine Entry Points in Realtime. I made my own software tool with based on Stochastic, Price Oscillator and 3 Moving Averages to trade on Realtime Market. It works perfect.

Definition and Interpretation of Stochastic Oscillator:
A technical momentum indicator that compares a security's closing price to its price range over a given time period. The oscillator's sensitivity to market movements can be reduced by adjusting the time period or by taking a moving average of the result. This indicator is calculated with the following formula:
%K = 100[(C - L14)/(H14 - L14)]
C = the most recent closing price L14 = the low of the 14 previous trading sessions H14 = the highest price traded during the same 14-day period.
%D = 3-period moving average of %K

The theory behind this indicator is that in an upward-trending market, prices tend to close near their high, and during a downward-trending market, prices tend to close near their low. Transaction signals occur when the %K crosses through a three-period moving average called the "%D".

Example Chart of Stochastic Oscillator:


This chart created with IntelliChart Realtime from Intelligence Data Service. See http://www.idslindia.com/ for more details.

Tuesday, August 19, 2008

Aroon Oscillator

A trend-following indicator that uses aspects of the Aroon indicator ("Aroon up" and "Aroon down") to gauge the strength of a current trend and the likelihood that it will continue. The Aroon oscillator is calculated by subtracting Aroon down from Aroon up. Readings above zero indicate that an uptrend is present, while readings below zero indicate that a downtrend is present.

Aroon up and Aroon down are the two components that comprise the Aroon indicator. The notion is that an asset is trending up when a stock is trading near the high of its range. Aroon up is used to measure the strength of the uptrend, while Aroon down is used to measure the strength of the downtrend. Many traders will watch for a cross above the zero line to suggest the beginning of a new uptrend. Conversely, a cross below zero would indicate the start of a downtrend. Readings near zero suggest that a security may be trending sideways and that this period of consolidation could continue.

Accumulation/Distribution

Accumulation/Distribution Technical Indicator is determined by the changes in price and volume. The volume acts as a weighting coefficient at the change of price รข€” the higher the coefficient (the volume) is, the greater the contribution of the price change (for this period of time) will be in the value of the indicator.

In fact, this indicator is a variant of the more commonly used indicator On Balance Volume. They are both used to confirm price changes by means of measuring the respective volume of sales.

When the Accumulation/Distribution indicator grows, it means accumulation (buying) of a particular security, as the overwhelming share of the sales volume is related to an upward trend of prices. When the indicator drops, it means distribution (selling) of the security, as most of sales take place during the downward price movement.

Divergences between the Accumulation/Distribution indicator and the price of the security indicate the upcoming change of prices. As a rule, in case of such divergences, the price tendency moves in the direction in which the indicator moves. Thus, if the indicator is growing, and the price of the security is dropping, a turnaround of price should be expected.

Calculation:
A certain share of the daily volume is added to or subtracted from the current accumulated value of the indicator. The nearer the closing price to the maximum price of the day is, the higher the added share will be. The nearer the closing price to the minimum price of the day is, the greater the subtracted share will be. If the closing price is exactly in between the maximum and minimum of the day, the indicator value remains unchanged.

A/D(i) =((CLOSE(i) - LOW(i)) - (HIGH(i) - CLOSE(i)) * VOLUME(i) / (HIGH(i) - LOW(i)) + A/D(i-1)

Where:
A/D(i) importance of the Indicator of the Accumulation/Distribution for the current bar;
CLOSE(i) the price of the closing the bar;
LOW(i) the minimum price of the bar;
HIGH(i) the maximum price of the bar;
VOLUME(i) volume;
A/D(i-1) importance of the Indicator of the Accumulation/Distribution for previous bar.

Trading UseAccumulation Distribution is usually used as a divergence indicator, with long entries signaled by bullish divergence, and short entries signaled by bearish divergence. Accumulation Distribution can also be used as an exit indicator, by showing the end (or the weakening) of the current trend.

Monday, August 18, 2008

Accumulation Swing Index (ASI)

Accumulation Swing Index (ASI)

ASI was created by Wales Wilder as an ordinary fluctuations indicator that gets signals from previous maximums and minimums of price. Once, Wilder said: "Somewhere amidst the maze of Open, High, Low and Close prices is a phantom line that is the real market." What helps us reveal this phantom line is the cumulation index.

In his book "New Concepts in Technical Trading Systems", Wilder describes the indicator this way: "When the Index is plotted on the same chart as the daily bar chart, trend lines drawn on the ASI can be compared to trend lines drawn on the bar chart. For those who know how to draw meaningful trend lines, the ASI can be a good tool to confirm trend-line breakouts. Often erroneous breaking of trend lines drawn on bar charts will not be confirmed by the trend lines drawn on the ASI. Since the ASI is heavily weighted in favor of the close price, a quick run up or down during a day's trading does not adversely affect the index."

With the ASI attempting to show the "real market," it closely resembles actual prices. This allows usage of classic support/resistance analysis on the ASI. Standart analysis involves looking for breakouts, new highs and lows, and divergences. Wilder points out the following characteristics of ASI:

It gives quantitation parameters of price changing.
It shows the turning points of short-term changing.
It gives a possibility to understand the real power and trend of the market.

Calculation

SI(i) = 50*(CLOSE(i-1) - CLOSE(i) + 0,5*(CLOSE(i-1) - OPEN(i-1)) + 0,25*(CLOSE(i) - OPEN(i)) / R)*(K / T)ASI(i) = SI(i-1) + SI(i)

Where:
SI (i)- current value of Swing Index technical indicator;
SI (i - 1)- stands for the value of Swing Index on the previous bar;
CLOSE (i)- current close price;
CLOSE (i - 1)- previous close price;
OPEN (i)- current open price;
OPEN (i - 1)- previous open price;
R - the parameter we get from a complicated formula based on the ratio between current close price and previous maximum and minimum;
K - the greatest of two values: (HIGH (i - 1) - CLOSE (i)) and (LOW (i - 1) - CLOSE (i));
T - the maximum price changing during trade session;
ASI (i) - the current value of Accumulation Swing Index.

Sample Chart for Accumulation Swing Index (ASI) for BANK OF INDIA